Account Reports Guide
This document describes the Reports page in the Teliqon Portal and explains how to use the Calls and SMS summary reports. It covers the tab structure, filtering, grouping, export options, report parameters, and pagination controls.
General Information
On the Reports page, two summary reports are available - for calls and SMS.
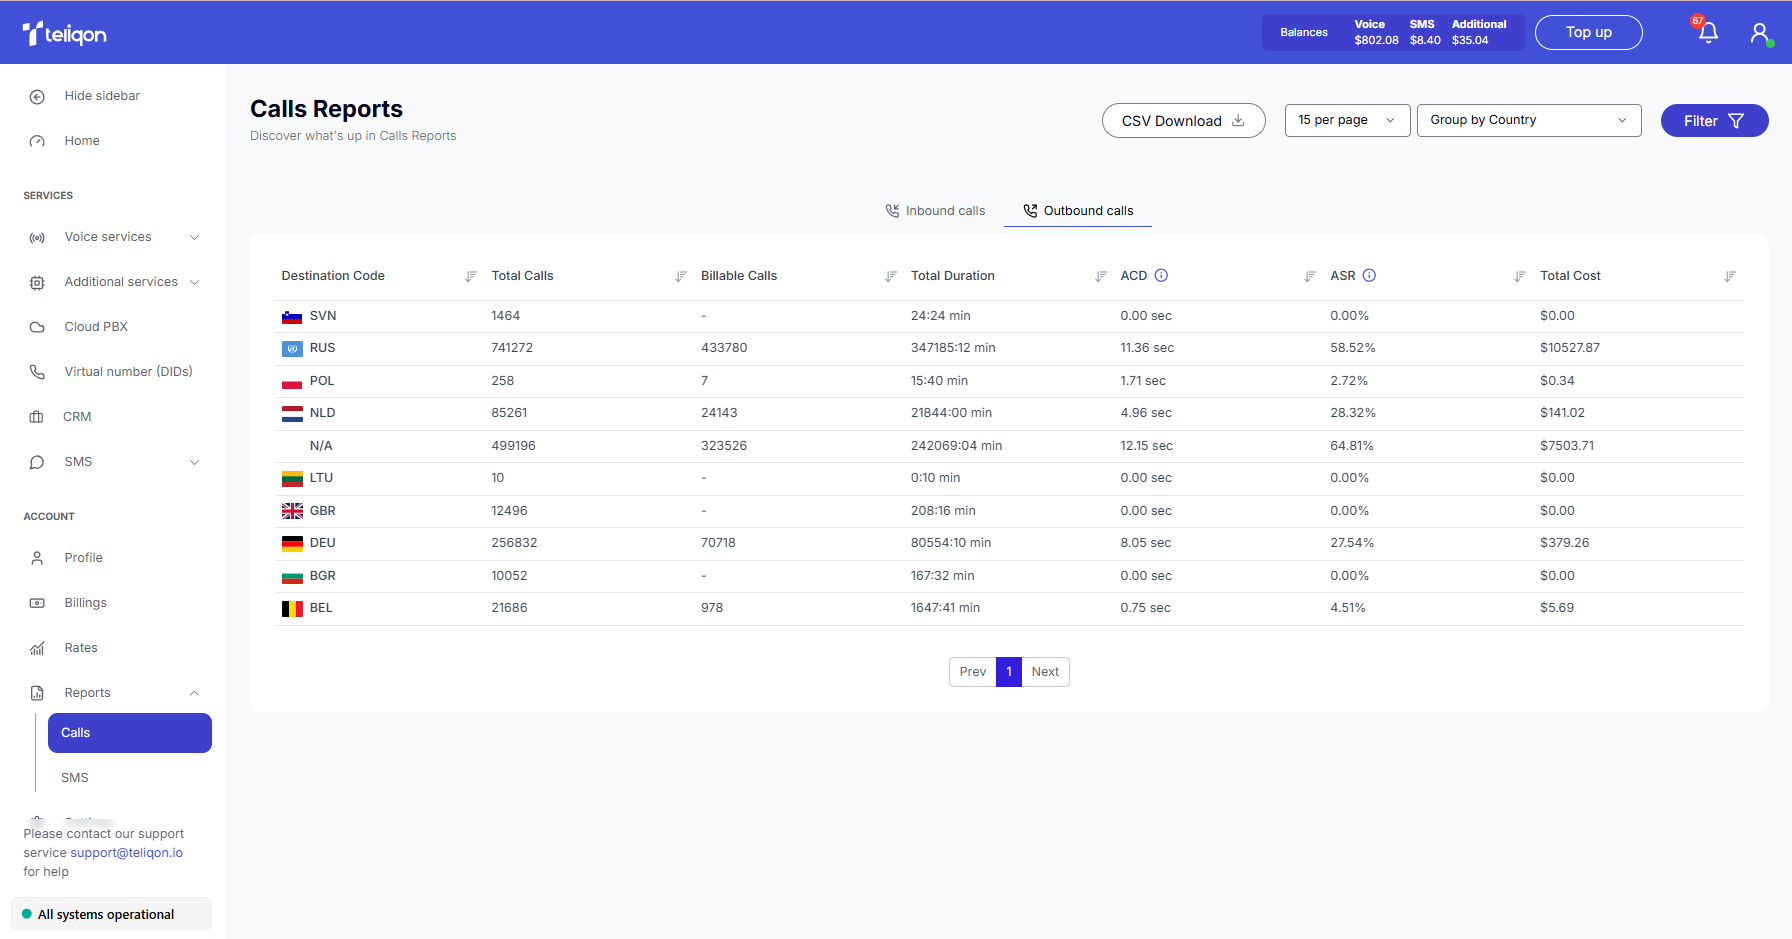
Calls
The Calls tab contains the following elements:
- Top toolbar;
- Summary report with parameters;
- Bottom toolbar. You can access this page from the sidebar menu on the left:
Top toolbar
The top toolbar consists of the following elements:

- Switching between tabs. Currently, only one tab is available - “Outbound Calls”. The “Inbound Calls” report will be added in future updates, at which point you will be able to switch between the two reports.
- Filter button
- Group by button
- Export report button CSV Download.
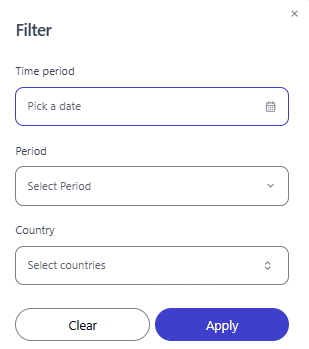
Filter
Using the Filter button, you can filter data by the following parameters:
a. Date - select the date in the calendar for which you want to display call information.To set a date range, use one of the following methods:
- Click on the dates in the calendar, selecting the start and end dates;
- Select one of the preset options (“Today”, “Yesterday”, “This week”, “This month”, “This year”). To apply the changes, click the Apply button.
If you change your mind, you can close the calendar by clicking on the empty space outside of it or reset the selected dates using the Clear button.
b. Time Period - select the required interval from the list (Hour, Day, Week, Month).
c. Country - select one or more countries from the list to display their statistics.
You can combine these parameters to obtain more detailed data.
Once you have selected the required filtering parameters - you need to click the Apply filters button.
If you want to reset all filter values - click Clear all.
Group by
Instead of viewing each call individually, the system groups them into categories and calculates summary metrics (count, duration, cost, etc.).
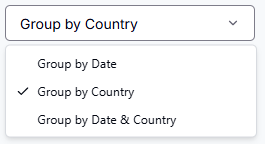
You can group calls by:
- Date - grouping by time to analyze load dynamics. The system aggregates calls by days and hours. For example: if a total of 26 calls were made on March 2nd, the report will show the exact number of calls for each hour of that day separately, provided that the “Hour” time interval is selected in the filter.
- Country - analysis of popularity and costs by geographic directions. The system groups all calls by a specific country and displays summary statistics on costs and call duration for that direction.
- Date & Country - a highly detailed report using both parameters simultaneously. It shows statistics for each country broken down by each day, allowing you to accurately track changes in traffic and costs for specific directions over time. By default, grouping is set to Country.
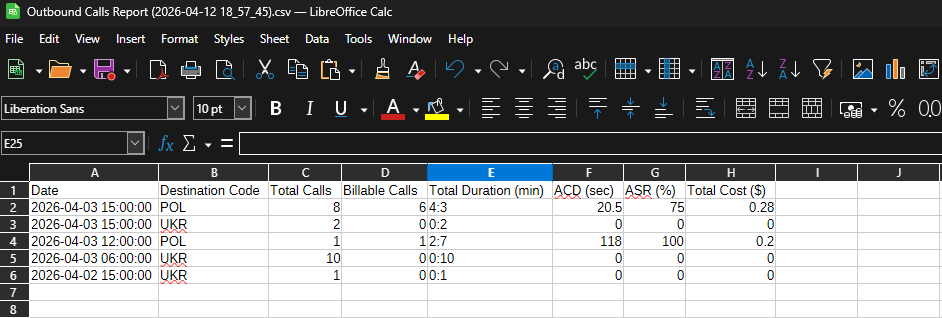
CSV Download
After clicking the export report button, a CSV file will be downloaded to your device.
The data in the file is generated according to all applied filters and grouping parameters.
Example of exported data:
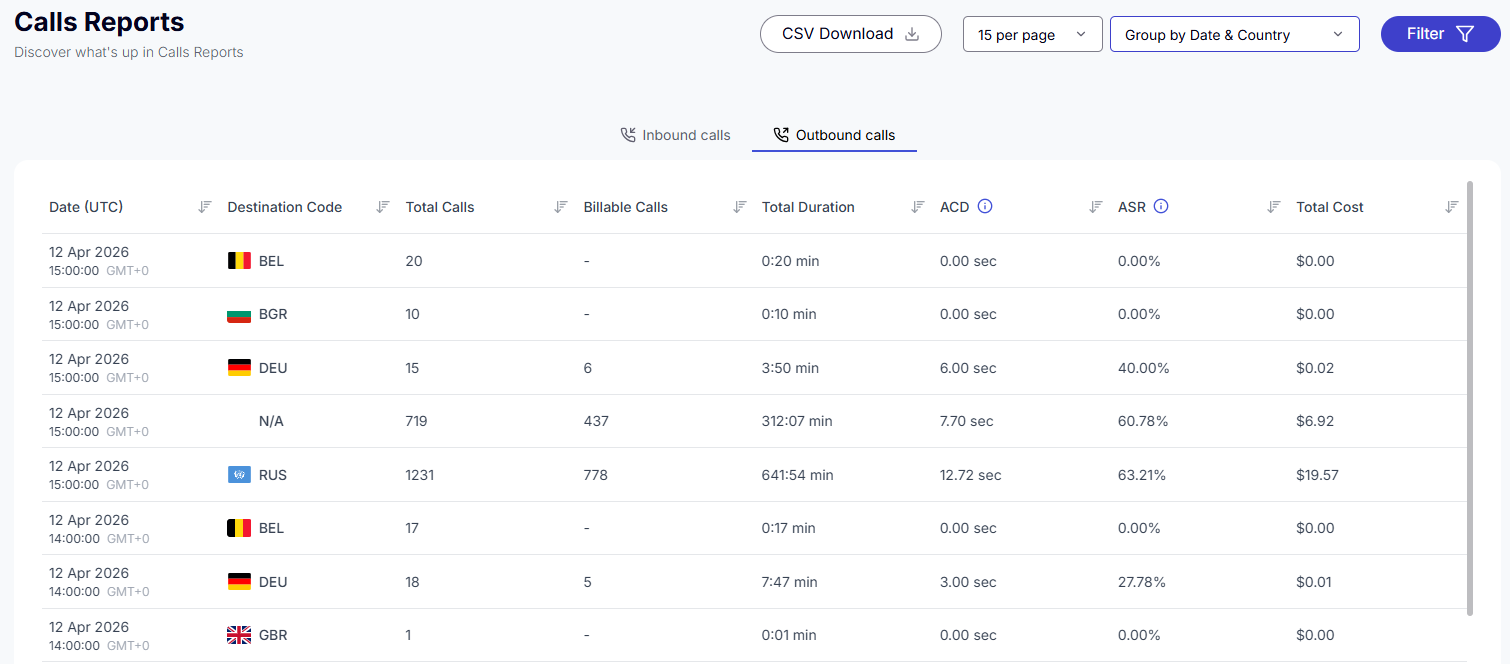
Call summary report
Depending on the selected call type and the applied filters and grouping, you will see a summary call report. This allows you to analyze traffic and control costs in real-time, evaluate connection quality for specific directions, and track the overall efficiency of your telephony.

Description of report parameters:
- Date (UTC) - displayed when grouping by Date. Shows the start of the time interval (hour and day) for which the data in a single row is aggregated. This allows you to compare activity and load across different periods.
- Destination Code - appears when grouping by Country. Displays the country name and its international ISO code (e.g., UKR, POL). All metrics within a single row apply specifically to this geographic direction.
- Total Calls - the total number of all call attempts within a single row (including unsuccessful ones). This indicates the overall traffic volume for the selected criteria.
- Billable Calls - the number of successful connections within a single row for which the system charged a fee.
- Total Duration - the total duration of all paid calls within a single row. This allows you to quickly assess the total billable time for the selected period or direction.
- ACD (Average Call Duration) - the average duration of a single successful call within a single row. This metric helps analyze the substance of conversations and communication efficiency.
- ASR (Answer-Seizure Ratio) - the percentage of successful connections relative to the total number of attempts within a single row. This is the primary marker of connection quality and stability.
- Total Cost - the total cost of all calls recorded within a single row. This is the final financial indicator for the selected time or country.
A value sorting function is available in the table.
To activate this option, click the arrow next to the column name, and the data will be automatically sorted in ascending order. To change the order to descending, click the same arrow again.
Bottom toolbar
The bottom toolbar looks as follows:
It provides the following options:
-
Use page pagination;
-
Select the number of rows per page. The following options are available:
a. 10 per page;
b. 15 per page;
c. 25 per page;
d. 50 per page;
e. 100 per page;
f. 250 per page.
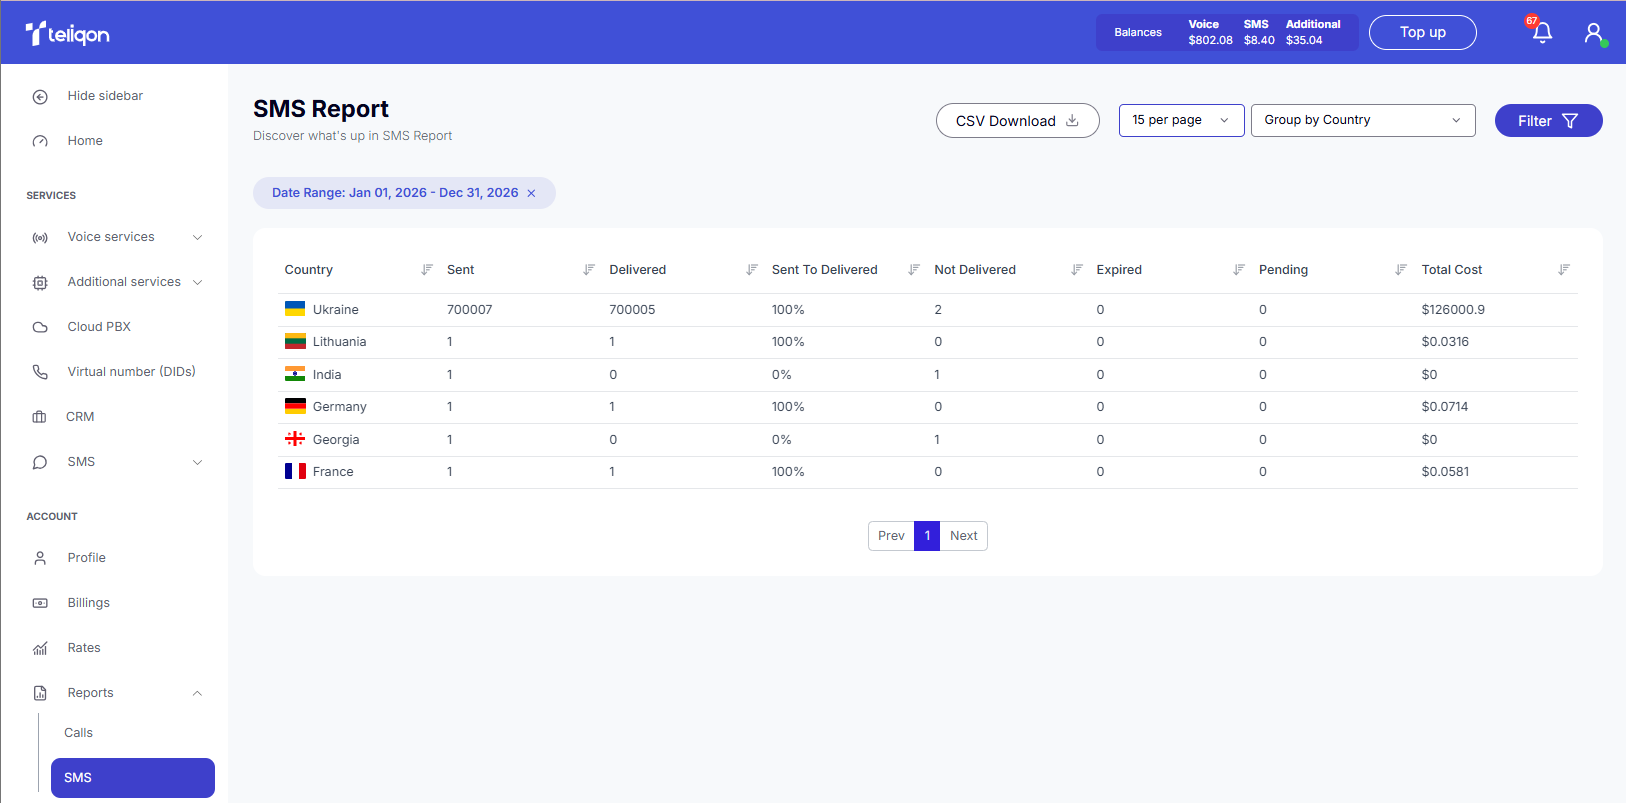
SMS
The SMS tab is identical in structure to the Calls tab and contains the following elements:
- Top toolbar;
- Summary report with parameters;
- Bottom toolbar. You can access this page from the sidebar menu on the left:

Top toolbar
The top toolbar consists of the following elements:
- Filter button - works similarly to the Calls section. The only difference is the presence of an additional SMS Price parameter for more detailed filtering of SMS messages.
- Group by button - grouping principles and options are identical to the Calls section;
- Export report button CSV Download - a detailed description of this function is provided in the Calls section.
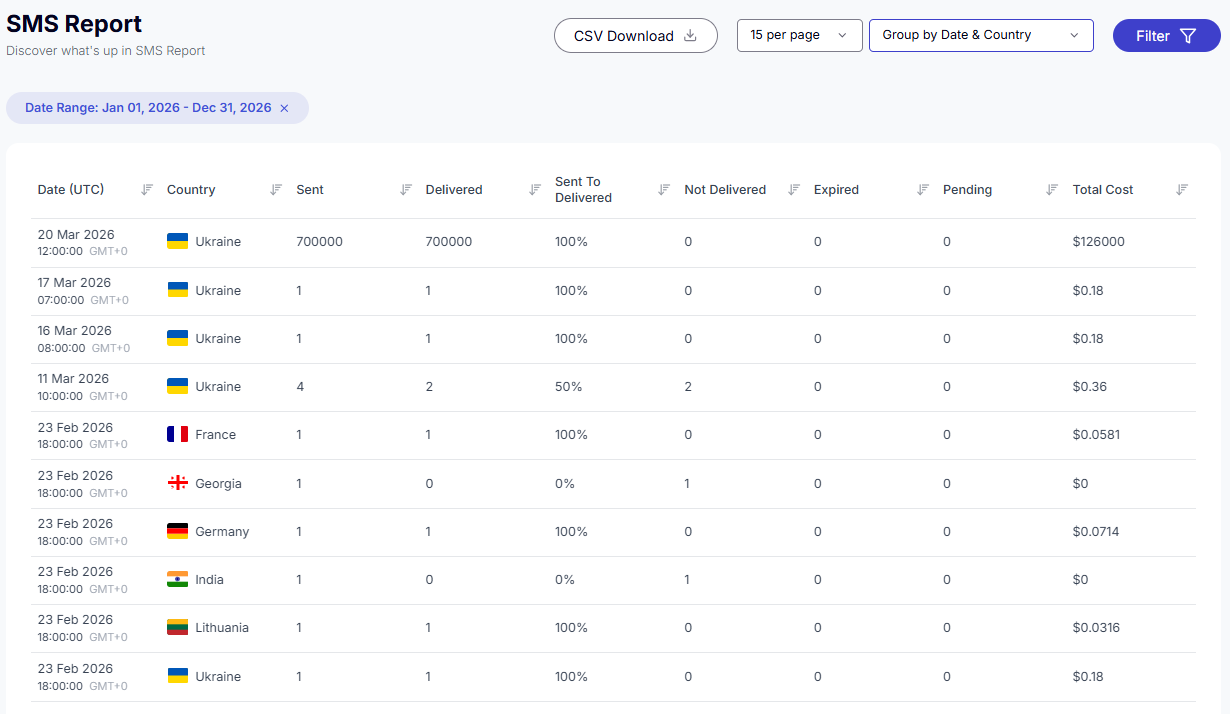
SMS summary report
Depending on the applied filters and grouping, you will see a summary SMS report. This allows you to analyze messaging volumes, control costs in real-time, and evaluate delivery efficiency for each direction.
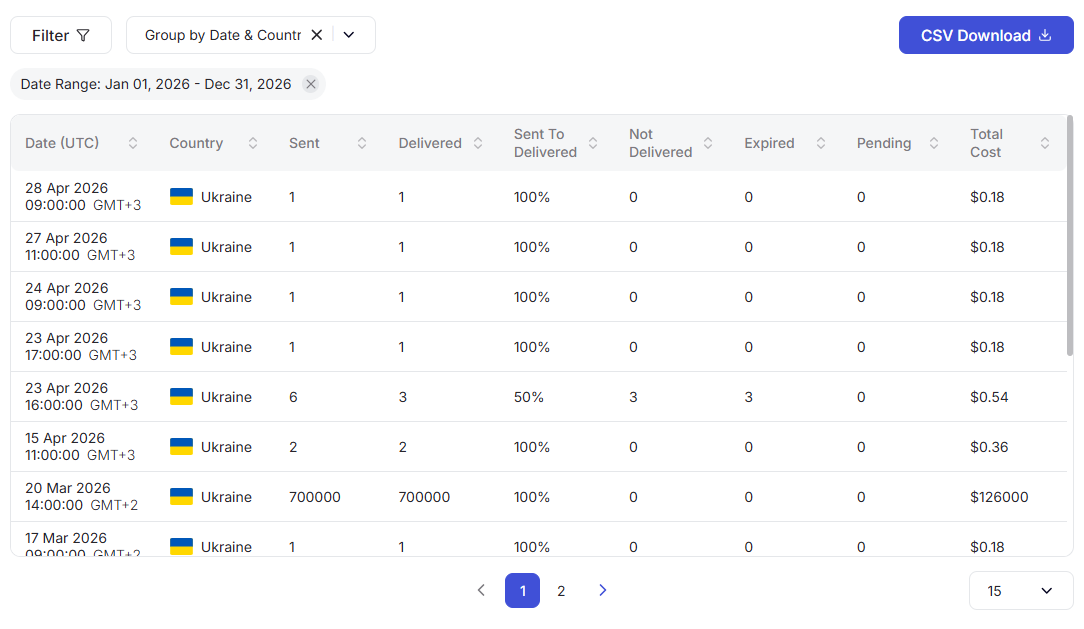
Description of report parameters:
- Date (UTC) - displayed when grouping by Date. Shows the start of the time interval (hour and day) for which the data in a single row is aggregated. This allows you to track messaging activity across different periods.
- Country - appears when grouping by Country. Displays the country name and its flag. All metrics within this row apply exclusively to the selected geographic direction.
- Sent - the total number of all messages sent within a single row. This indicates the overall volume of SMS traffic for the selected criteria.
- Delivered - the number of messages within a row that were successfully delivered to the final recipients.
- Sent To Delivered - the percentage of successfully delivered SMS messages relative to the total number sent within a row. This is the primary Delivery Rate indicator.
- Not Delivered - the number of messages that were not delivered due to errors, blocking, or rejection by the operator.
- Expired - the number of messages that expired before they could be delivered (for example, if the recipient's phone was turned off for too long).
- Pending - the number of messages that are still in the process of being delivered at the time the report is generated.
- Total Cost - the total cost of all SMS messages recorded within a single row. This is the final financial indicator for the selected time or country.
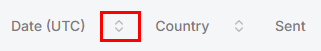
A value sorting function is available in the table.
To activate this option, click the arrow next to the column name, and the data will be automatically sorted in ascending order. To change the order to descending, click the same arrow again.
Bottom toolbar
The bottom toolbar looks as follows:

It provides the following options:
-
Use page pagination;
-
Select the number of rows per page. The following options are available:
a. 10 per page;
b. 15 per page;
c. 25 per page;
d. 50 per page;
e. 100 per page;
f. 250 per page.
Account Rates Guide
This page describes the Rates section in the Teliqon portal. It explains how to view tariffs, use filters, sort rate data, and manage pagination options.
Account Settings Guide
This document describes the Settings page in the Teliqon Portal and explains notification, API, balance, subscription, DID and report settings.
