Statistic
Statistic documentation. This file was converted from DOCX to MDX with extracted screenshots. Review headings, lists, links, images, and formatting against the source document before publishing. The page describes dashboards, filters, calendar controls, and performance analytics available in the CRM.
General information
This section provides analytical data on leads, deals, and your team's activity. These metrics enable an objective evaluation of business performance, allowing you to track successful deals, conversion efficiency, and other key indicators.
Main Dashboard Toolbar
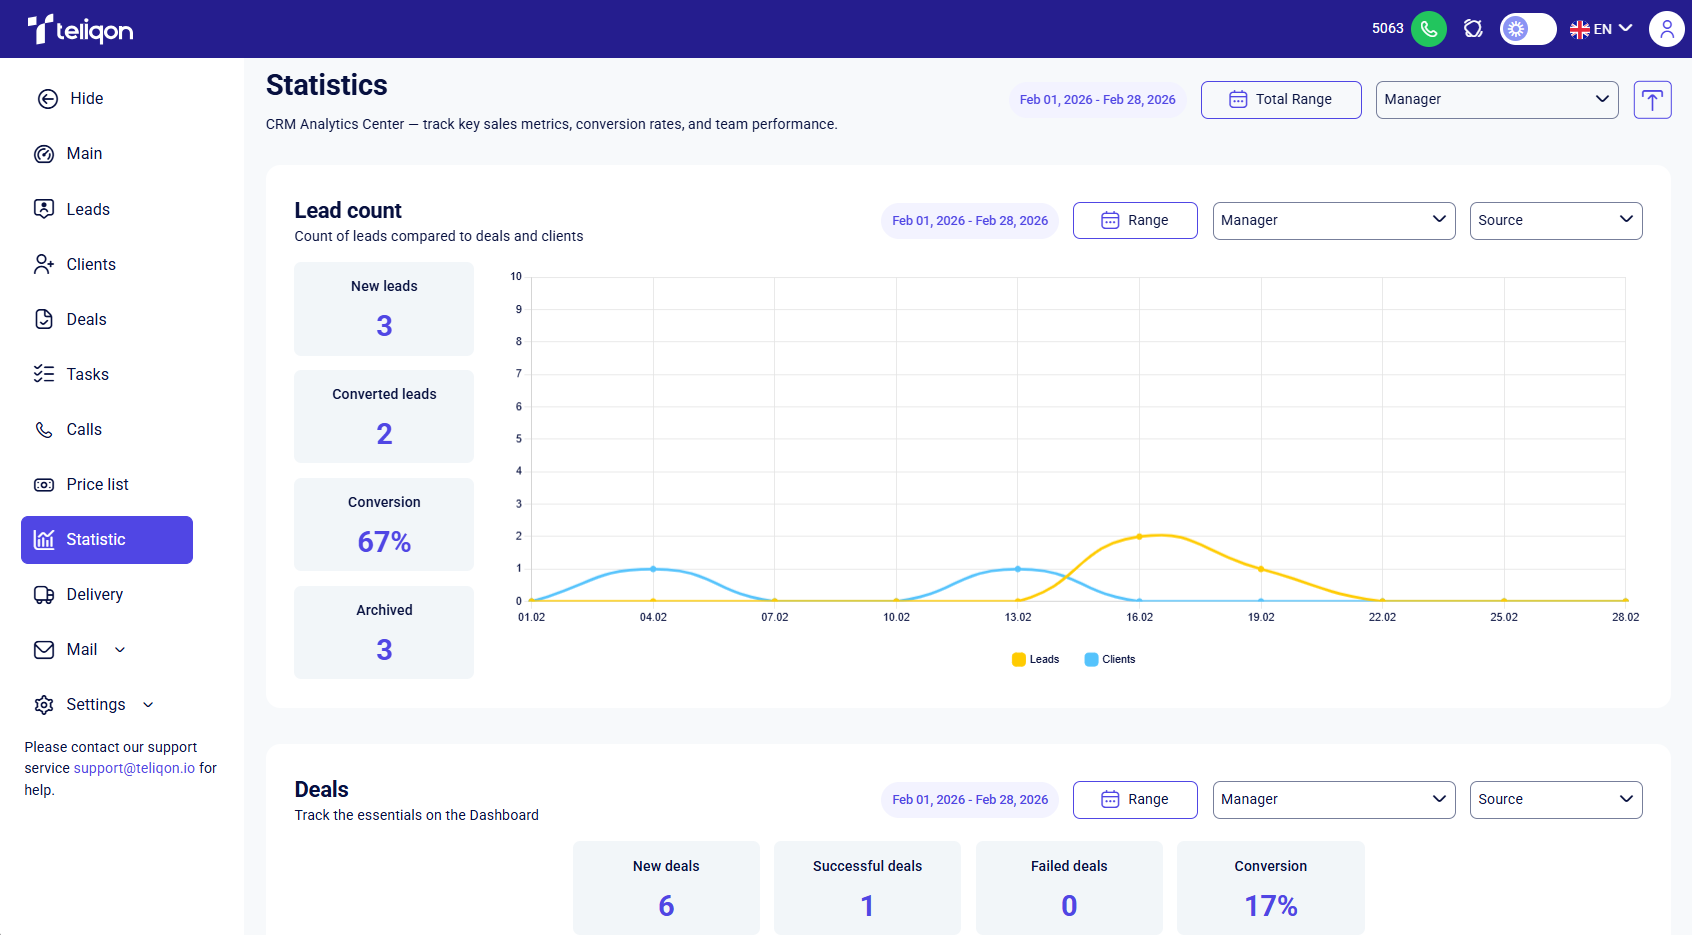
The page displays a panel for general filters and analytical data management:

The panel includes the following control elements:
- Total Range button: enables users to define a specific date range for the entire analytics dashboard. While the calendar interface operates similarly to the Lead count section, this setting applies changes globally across all visual data, whereas the standard Range button only modifies individual charts.
-
Manager dropdown menu: enables data filtering across all visual reports for a specific team member. Upon selection, the dashboard refreshes automatically to reflect the individual performance data of the chosen employee.
-
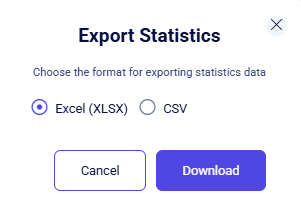
Download button: allows you to export statistics in XLSX or CSV format.
Lead count
This chart displays the number of project leads in relation to clients:
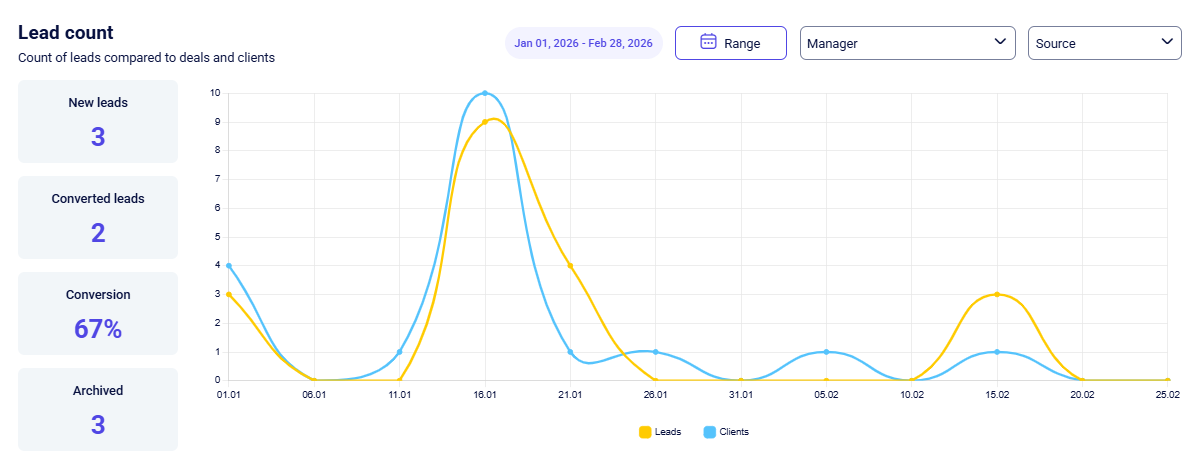
By default, all entities (leads, clients) are selected, but you can hide any that are not needed. To do this, click on the entity type you wish to exclude:
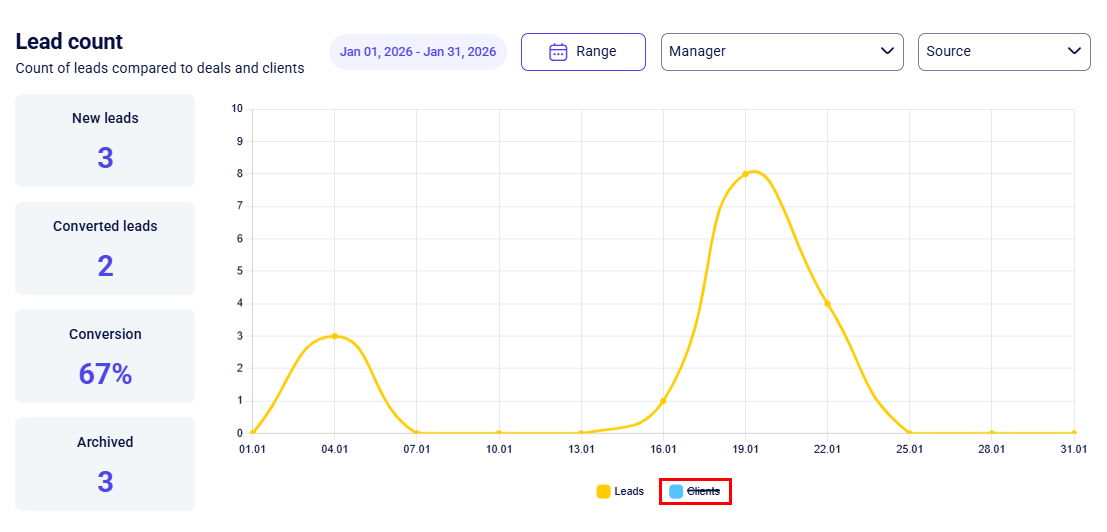
The following parameters are displayed separately:
- New leads - the total number of new inquiries (leads) received by the system within the specified timeframe.
- Converted leads - the number of leads that have been successfully transitioned to client status.
- Conversion - the percentage ratio of converted leads relative to the total number of new inquiries.
- Archived - the number of leads that have been moved to the archive.
Working with the Calendar
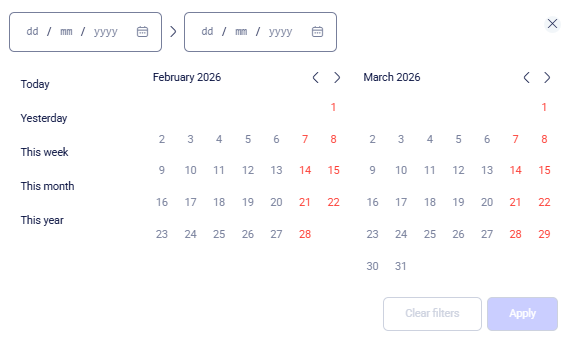
Range button - enables you to select a specific timeframe for the statistical data of an individual chart. Within the calendar window, you can define the time period using one of the following methods:
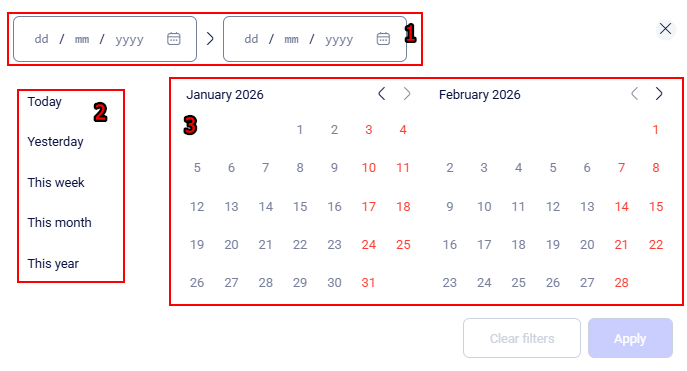
- Manual: enter the required timeframe in the From and To fields using the format: 12.01.2026 > 18.02.2026.
- Quick settings: select one of the predefined values (Today, Yesterday, This week, This month, or This year).
- Via Calendar: choose the start and end dates for the report directly within the interactive calendar:
- Left-click the start date, then click the end date of the desired period.
- To switch between months, use the "<" and ">" arrows located next to the month name.
After configuring the desired period, confirm your settings by clicking the Apply button.
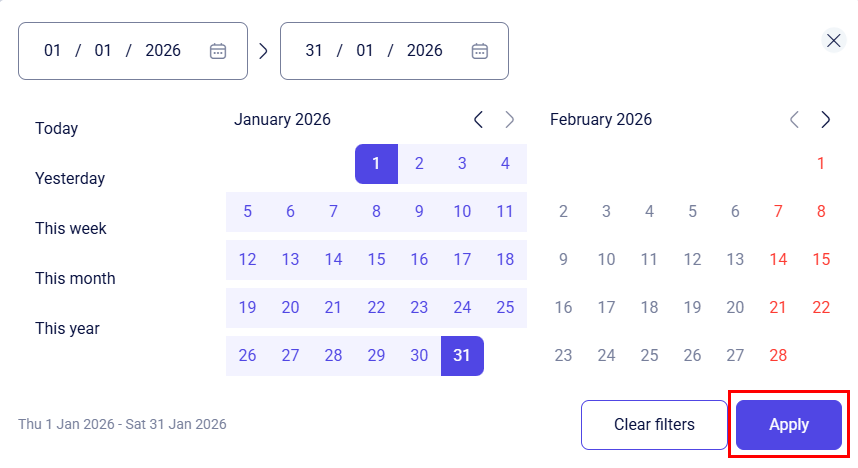
After saving the settings, the data on the corresponding chart will update automatically.
If you wish to reset the selected parameters while choosing a time period in the calendar, click the Clear filters button.
To close the calendar window and return to the dashboard without applying the selected date range, click the X icon in the upper-right corner of the calendar.
Manager and Source filters
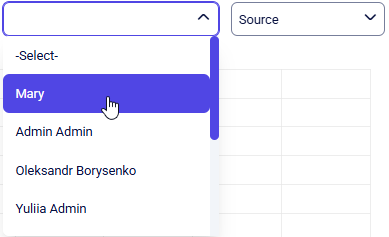
Manager dropdown menu - if you need to view statistics for specific employees, click the dropdown and select the desired name. The data on the specific chart will then update to reflect the performance of the selected manager.
Important: if you select a manager via the main panel, this filter will be automatically applied to all charts on the page.
Source dropdown menu - use this filter to view statistics broken down by customer acquisition channels. Select a specific source from the list, and the system will display data only for those leads or deals that originated from that channel.
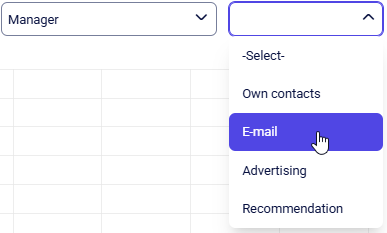
You can use the Manager and Source filters in combination to refine your data.
When both filters are active, the system displays results matching that specific criteria.
For example, showing how many leads from "Advertising" were handled specifically by "Oleksandr".
This allows you to evaluate how effectively individual team members manage different acquisition channels.
Deals
This dashboard displays key sales performance indicators in the form of individual cards. You can promptly track the following information:
- New deals;
- Successful deals;
- Failed deals;
- Conversion;
- Total Amount (USD / EUR / UAH);
- Successful Amount (USD / EUR / UAH);
- Failed Amount (USD / EUR / UAH).
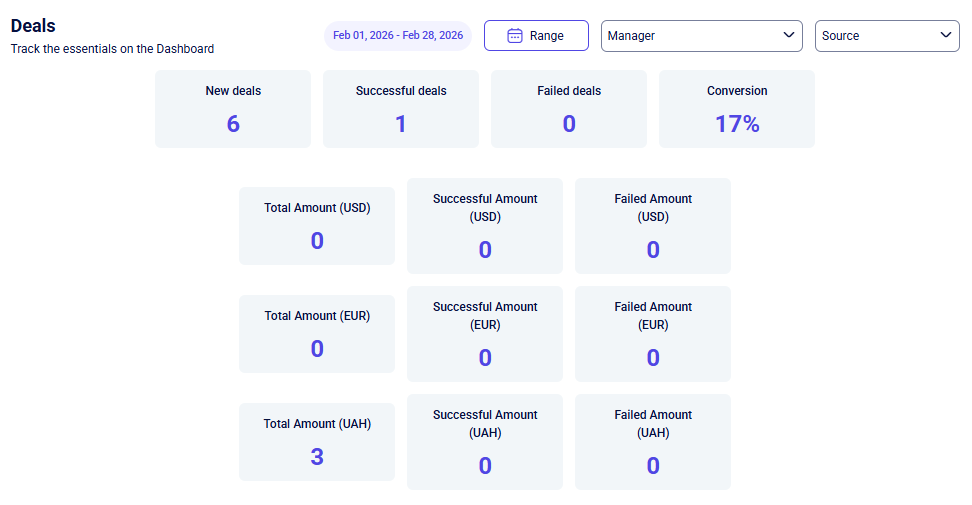
The Range, Manager, and Source filters function consistently across the system. They enable segmented analysis by timeframe, staff member, or acquisition source, and can be applied in combination for deep-dive reporting.
Manager Performance Table
This section provides a comprehensive overview of individual performance metrics, accessible via four primary tabs:
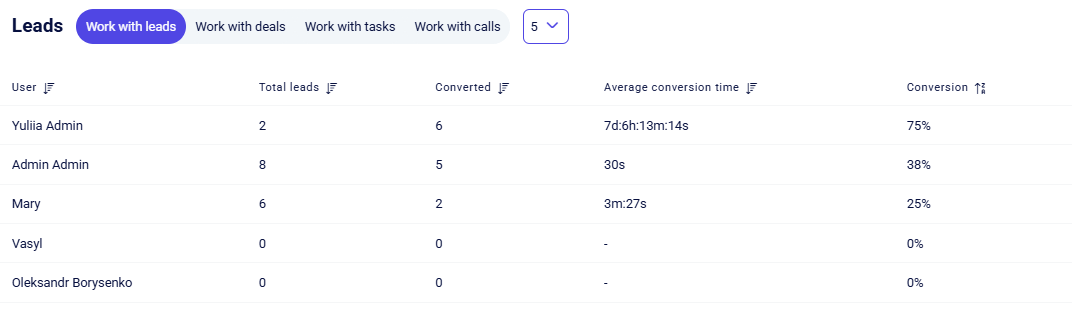
You can toggle between different statistics by selecting the corresponding tab, each containing specific parameters:
- Work with leads - tracks manager activity regarding new inquiries, including the total number of leads received, the count of converted contacts, conversion rate, and average conversion time.
- Work with deals - evaluates financial efficiency and sales results through metrics such as the number of won and lost deals, total amounts for these categories, conversion rate, and the average check for both successful and failed deals.
- Work with tasks - monitors team productivity by showing the ratio of created to completed tasks, along with the overall percentage of successfully closed tasks.
- Work with calls - provides call activity statistics. You can view the count of all call types (incoming, outgoing, missed), average call duration, and the total time managers spent on the line.
To view manager statistics for a specific period, use the Total Range button and select the desired dates in the calendar.
Each column header features a quick filter button for effortless data sorting:
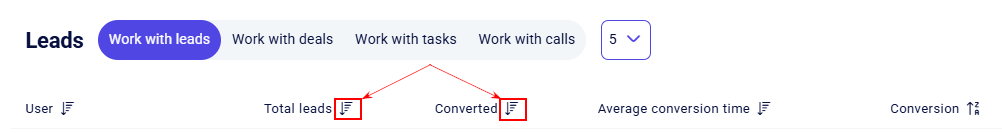
Only one quick filter can be active at a time. It has three states, which you can toggle between by clicking on the filter:
- No sorting;
- Sort descending;
- Sort ascending.
Clicking a different quick filter will reset the previously selected filter to its initial state (no sorting).
Additionally, this section includes a pagination tool that allows you to limit the number of records displayed per page. The following options are available:
- 5;
- 10;
- 25;
- 50;
- 100
Price list
The Price List section contains all the products and services within your project. This guide explains how to manage items and categories, work with the product/service card, and use import and export tools. It also covers filters, barcodes, notes, and file opening instructions for Excel and Google Sheets.
Delivery
This document describes the Delivery section in Teliqon CRM and explains how shipment records are viewed and managed. It covers TTN handling, search, filtering, bulk actions, and the delivery parameters shown in the main table.
