Main
This document describes the Main dashboard in Teliqon CRM and explains the statistical charts available on the page. It covers how to configure date ranges for all charts and how to work with Sales activity, Activity distribution, and Calls count widgets.
General Information
The main page of Teliqon CRM contains three key statistical charts that allow you to monitor your project’s performance:
-
Sales activity;
-
Activity distribution;
-
Calls count.
You can configure the time ranges for these charts - either individually for each chart or collectively for all charts at once.
The configuration is done using the calendars available on each chart.
Additionally, there is a global calendar on the dashboard that allows you to adjust the time range for all charts simultaneously.
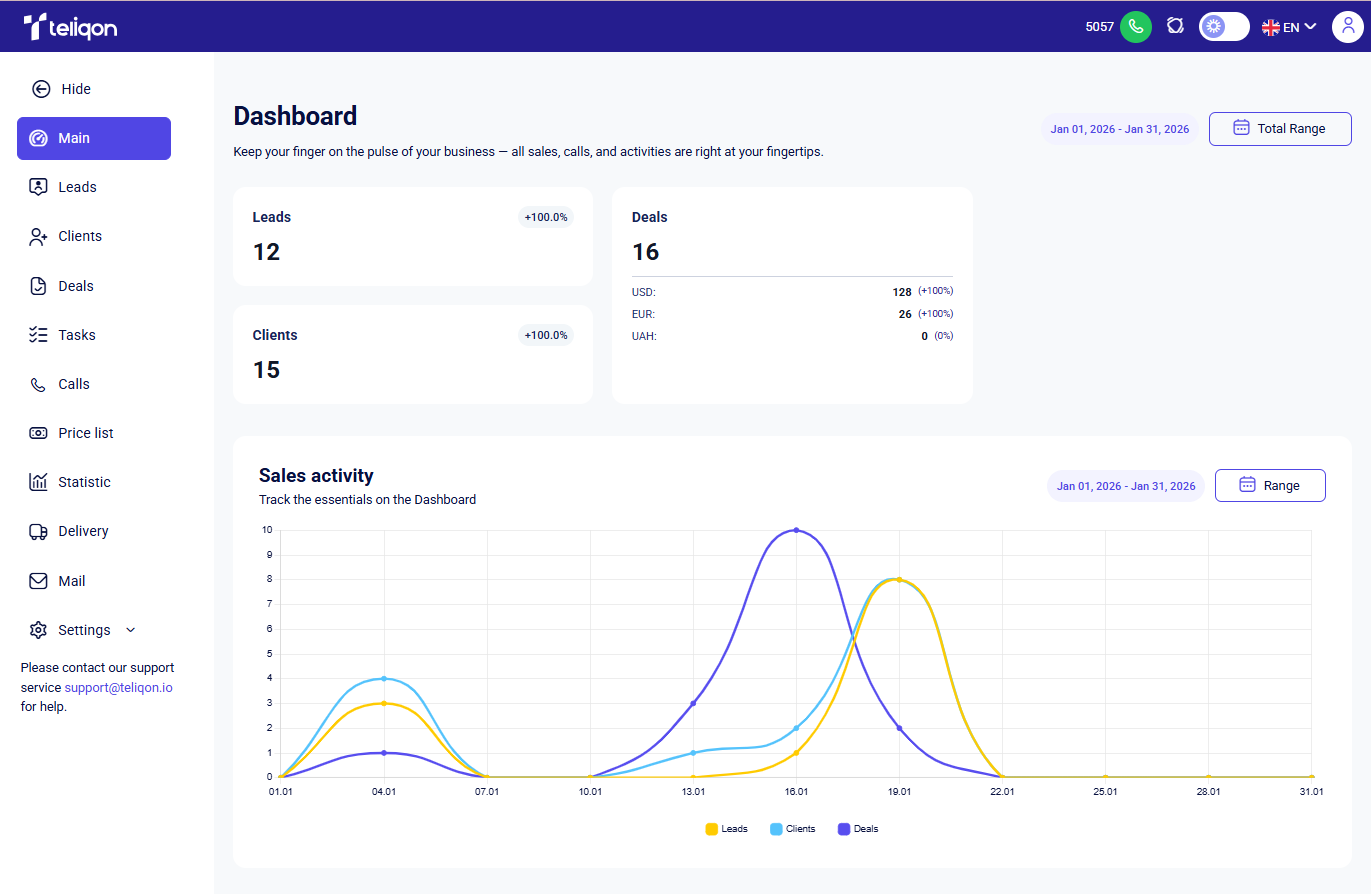
To access this page and view the project summary statistics in Teliqon CRM, go to the Main section in the left sidebar menu.
Charts overview and Calendar usage
Total Range
Using the Total Range on the dashboard, you can select a time period for which data will be displayed across all charts.
You can choose the time period for which you want to view statistics in one of the following ways:
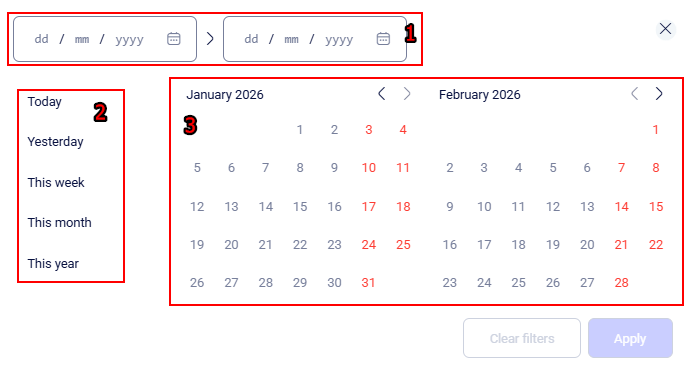
-
Enter the time range manually in the From and To fields, using the format: 12.01.2026 > 18.02.2026
-
Select one of the predefined options:
-
Today;
-
Yesterday;
-
This week;
-
This month;
-
This year.
-
Select a start and end date using the embedded calendar.
Choose the start date by hovering over the day and clicking the left mouse button. Then, select the end date in the same way. To select a date from another month, click the < > arrows next to the month name to navigate to the previous or next month.
After making your selection, click the Apply button to save and apply the chosen date range.
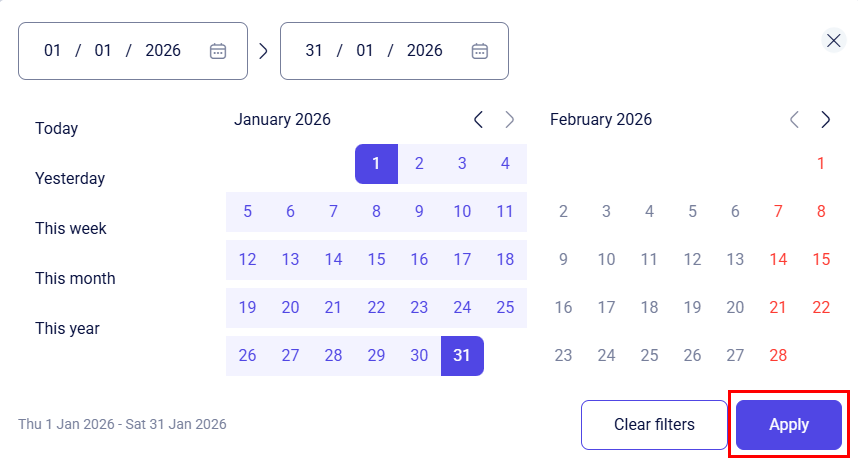
After saving the changes, the selected time range will be automatically applied to all charts on the main dashboard.
If you wish to reset the selected parameters while choosing a time period in the calendar, click the Clear filters button.
To close the calendar window and return to the dashboard without applying the selected date range, click the X icon in the upper-right corner of the calendar.
Sales activity
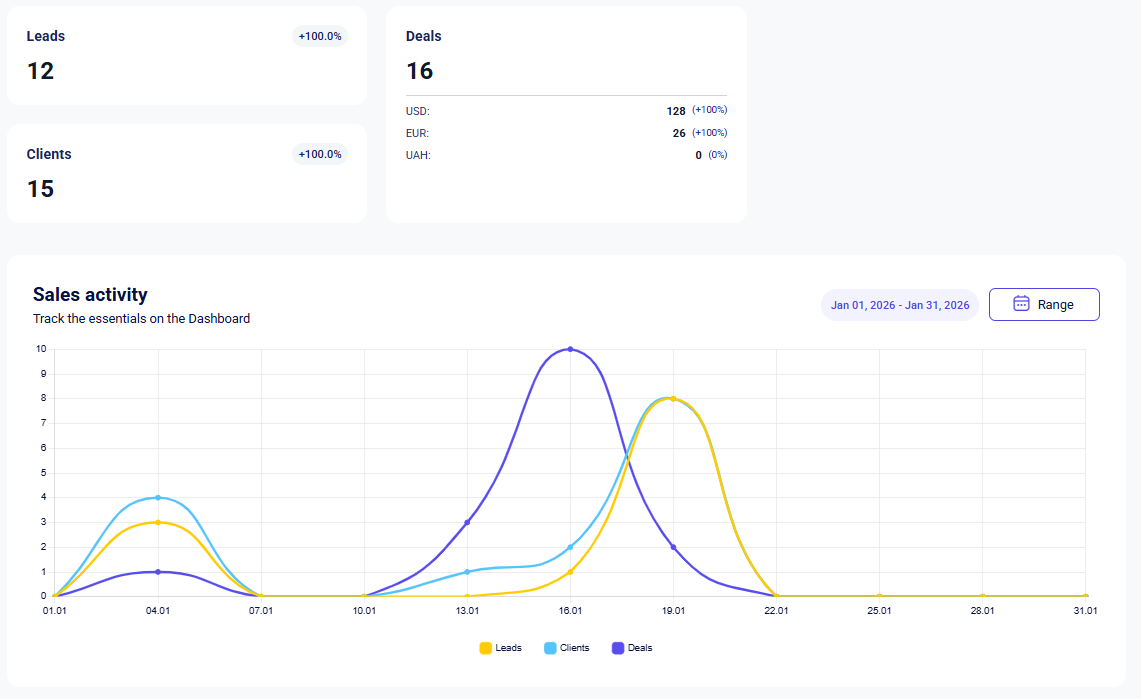
Track the total count of leads, clients, and deals within the system:
This metric allows you to visualize the creation of leads, clients, and deals over a selected period of time. Using this information, you can monitor the peak activity of your new clients in Teliqon CRM.
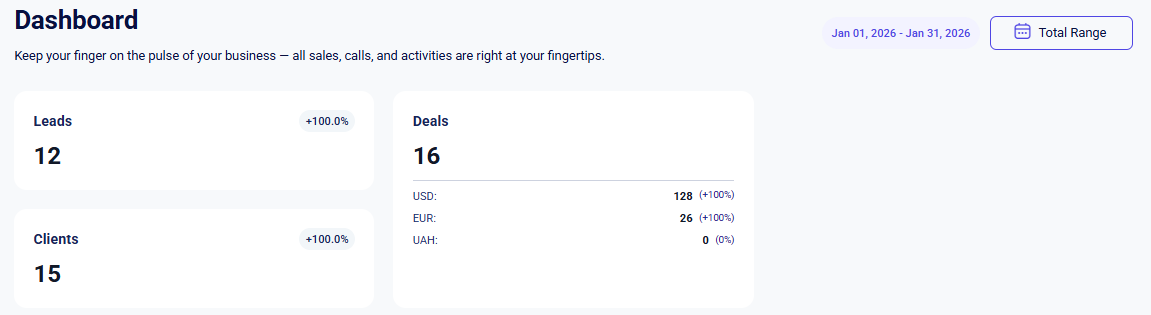
Additionally, the total number of leads, clients, and deals is displayed above the chart.
By default, all entities (leads, clients, and deals) are selected, but you can hide any that are not needed. To do this, click on the entity type you wish to exclude
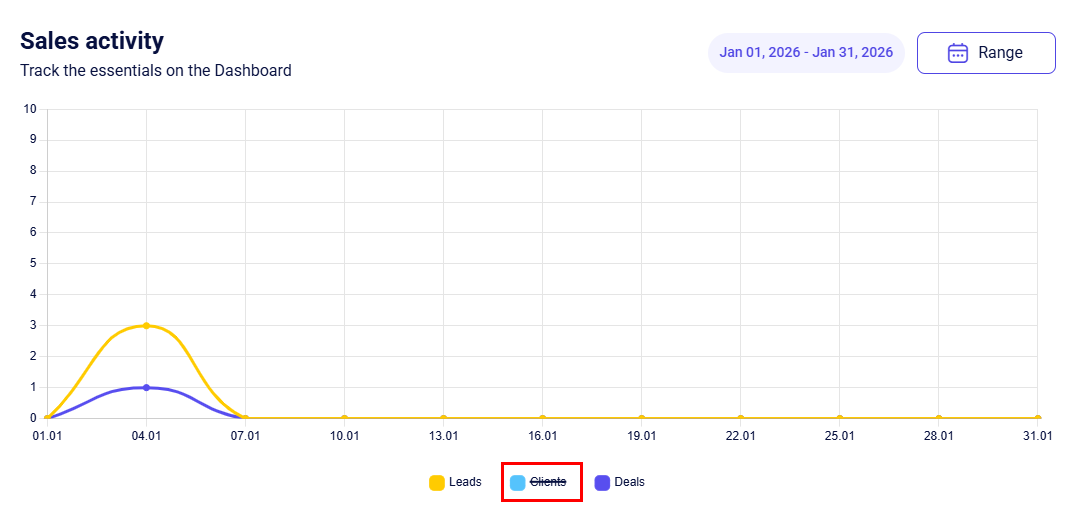
To show a hidden type again, simply click on it once more.
To change the date range for this specific chart, click the Range button. In the calendar that appears, select the required time period. For detailed instructions on setting the time period in the calendar, see the Total Range section.
Activity distribution
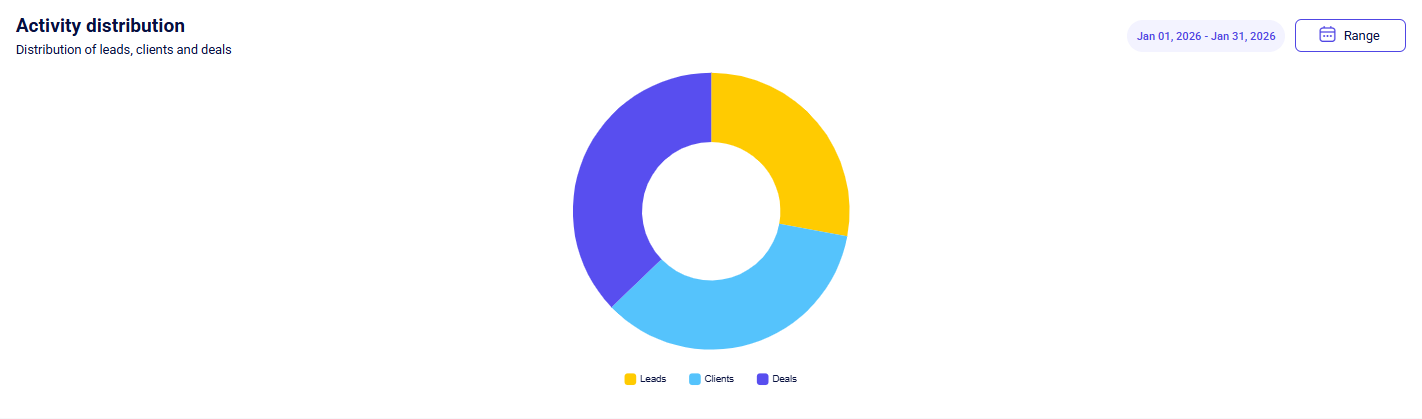
Distribution of Leads, Clients, and Deals:
This metric visualizes the percentage ratio of leads, clients, and deals created during the selected time period in relation to the total number of entities (leads, clients, deals). Using this information, you can track the overall number of newly created entities within the chosen time range.
By default, all entities (leads, clients, and deals) are selected, but you can hide any you don't need from the pie chart. To do this, click on the entity type you want to hide:
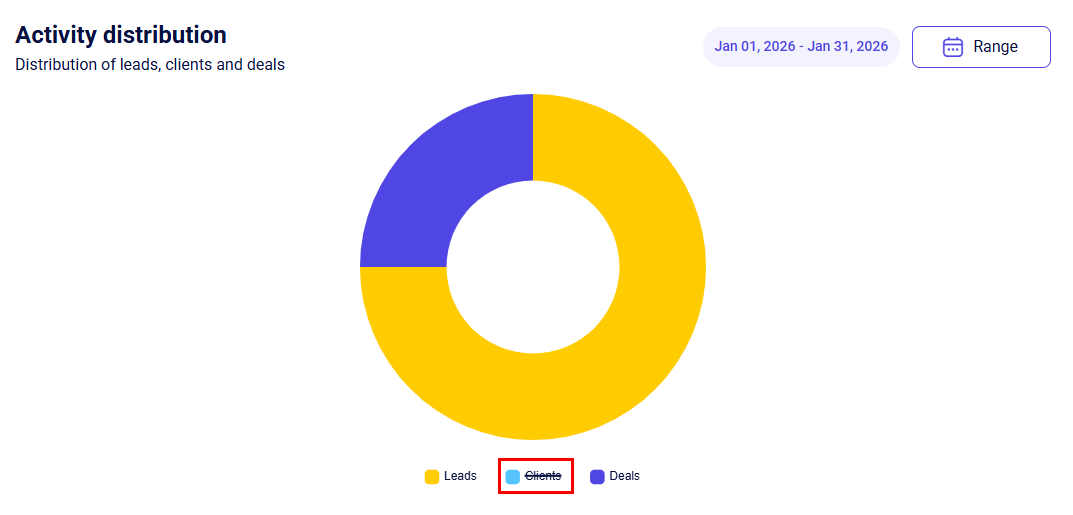
To show a hidden type again, simply click on it once more.
To change the date range for this specific chart, also click the Range button. In the calendar that appears, select the required time period. For detailed instructions on setting the time period in the calendar, see the Total Range section.
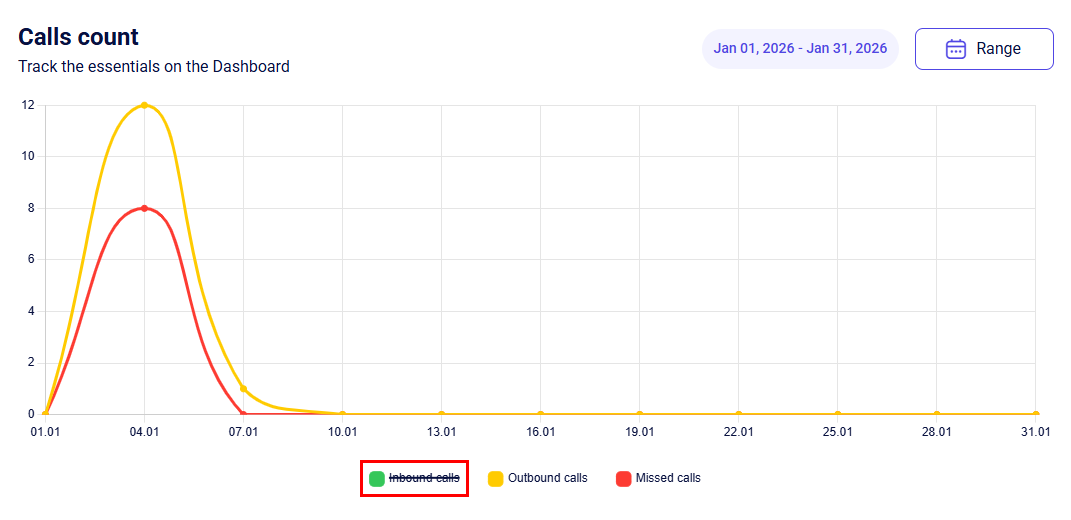
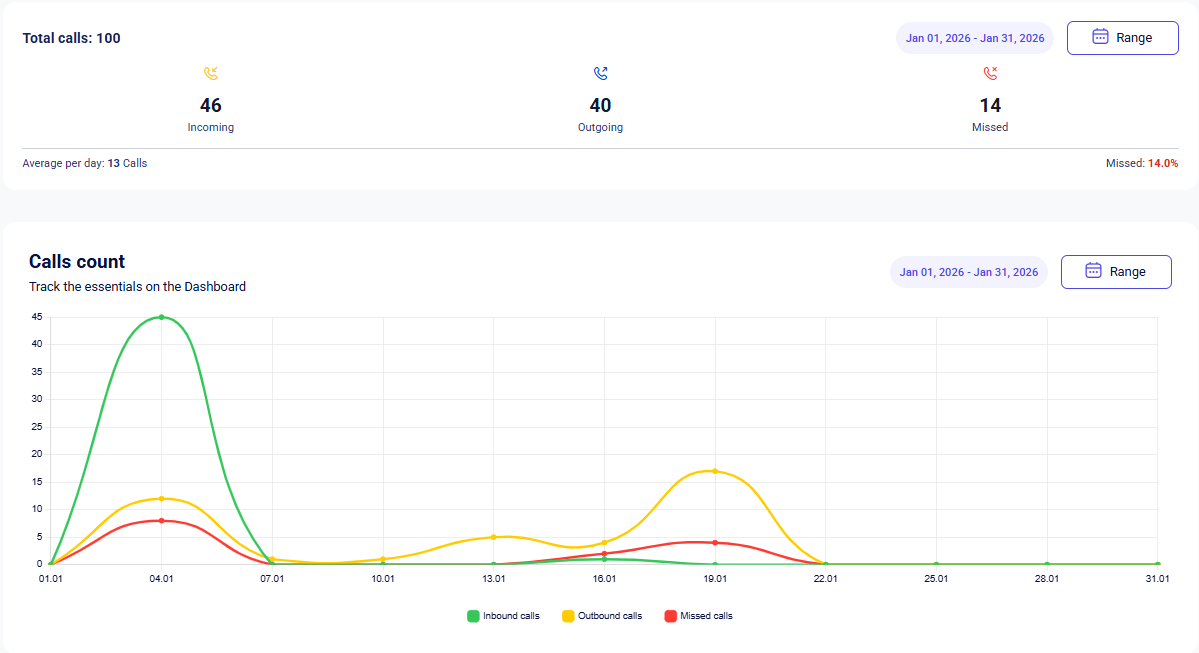
Calls count
Track the number of incoming, outgoing, and missed calls using filters:
The Calls count chart, in addition to the calendar, includes an extra configuration parameter - the call type to be displayed on the chart.
This metric visualizes the number of calls of each type made within the project during the selected time period.
By default, all call types are selected on the chart:
-
All calls;
-
Incoming calls;
-
Outgoing calls;
-
Missed calls.
You can hide any unnecessary call types from the chart. To do this, click on the name of the type you wish to hide:
Additionally, above the chart, there is a panel listing all calls for the selected period, categorized by call type.
To show a hidden type again, simply click on it once more.
To change the date range for this specific chart, also click the Range button. In the calendar that appears, select the required time period. For detailed instructions on setting the time period in the calendar, see the Total Range section.
WebRTC
This guide explains how to use the WebRTC client inside the Teliqon CRM interface. It describes how to initiate calls, manage active call sessions, and interact with CRM entities during a conversation. The document also outlines the available call controls and one-click dialing features.
Leads
This document describes the Leads section in Teliqon CRM and explains how leads are viewed, created, filtered, imported, exported, and managed. It also covers the lead card, delivery block, additional contacts, and tasks related to a lead.
