Reports
This document describes the Reports page in the Teliqon Autodialer Software system. It explains how to use CDR, Campaign statistics, and Agent statistics reports for call quality control, campaign effectiveness, and staff performance monitoring.
General information
The Reports page collects all the necessary information for call quality control, evaluating campaign effectiveness, and monitoring staff performance.
The page is divided into three sections:
- CDR. Technical records for each call, including:
-
Connection time and duration;
-
Caller and recipient numbers.
-
Call completion status and other technical parameters.
- Campaign statistics. A report on the effectiveness of dialing within a specific campaign:
-
Results and key indicators of database processing.
-
General performance statistics of the current campaign.
- Agent statistics. Analysis of operator productivity:
-
Time distribution: how much time the agent spent in each status.
-
Call log: the number of calls handled by the agent.
CDR
The CDR (Call Detail Record) report allows you to view detailed information about all calls made within your project for the selected period.
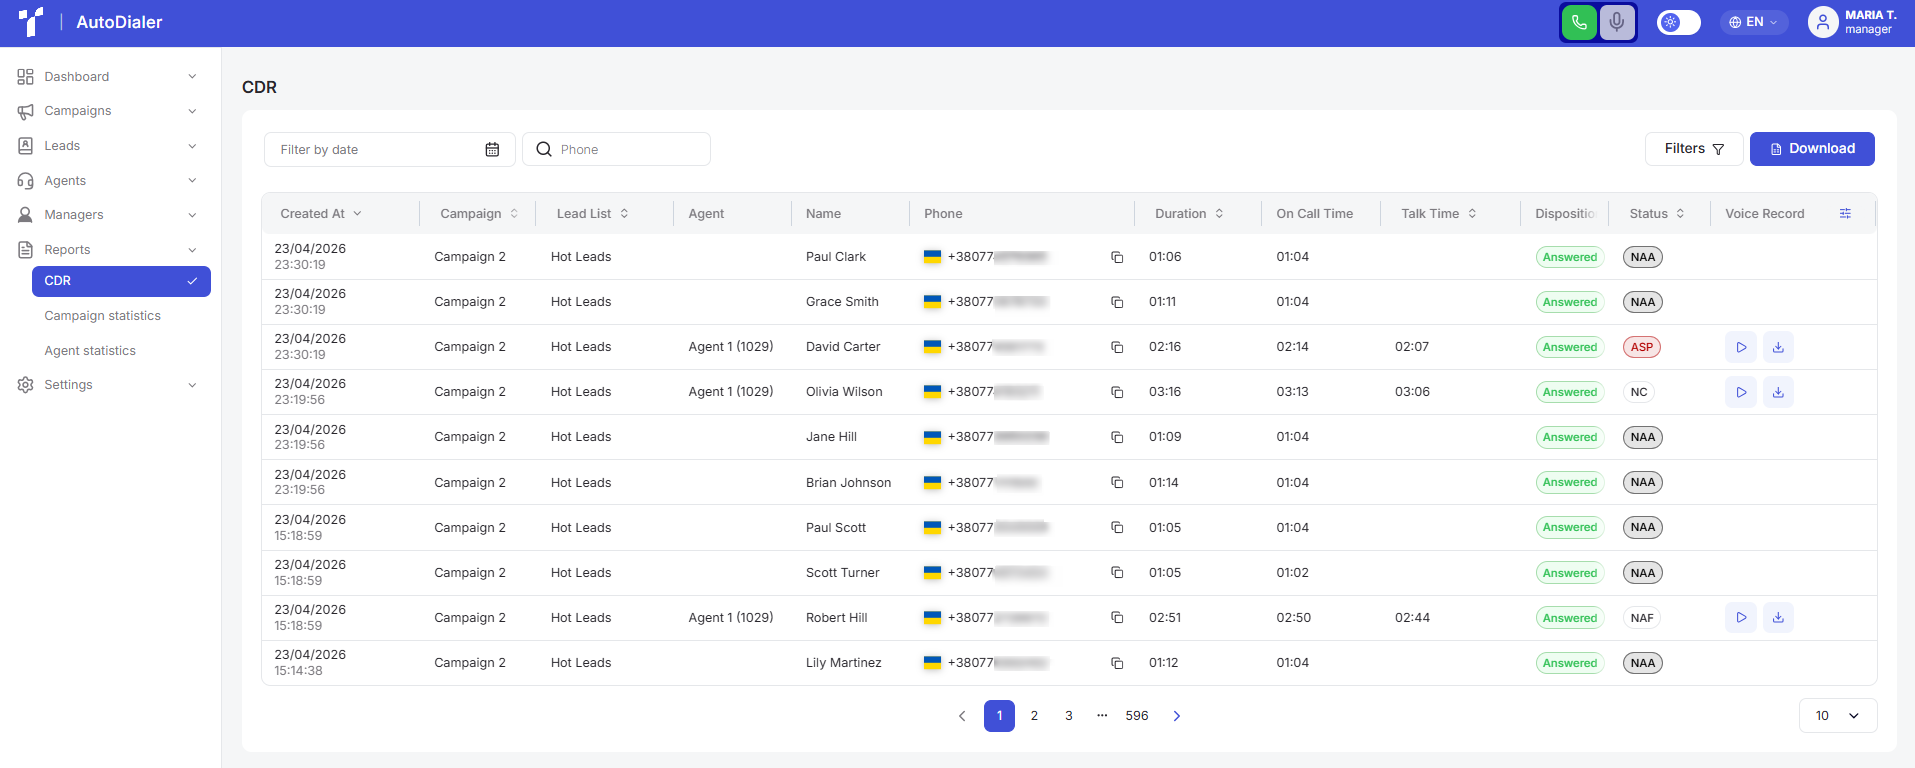
The section contains the following elements:
- Filters.
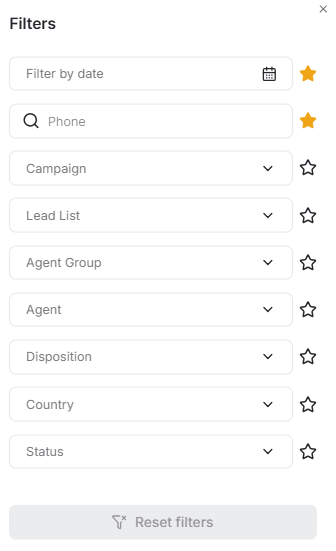
You can configure which filters appear in quick access on the top panel. To do this, click the Filters button to open a pop-up menu where you can add a specific filter to your favorites using the star icon. You can also apply the necessary filters directly within this window:
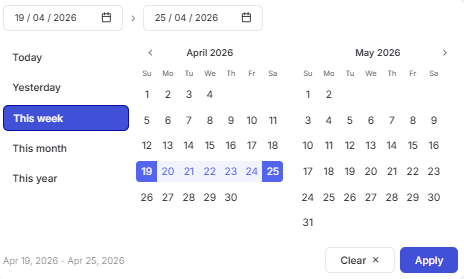
a. Filter by date opens a calendar used to select a date range for when campaigns were created. After clicking the calendar icon, a pop-up window will appear to select the required period. To set a date range, use one of the following methods:
-
Click the dates on the calendar to select the start and end dates;
-
Select one of the presets (“Today”, “Yesterday”, “This Week”, “This Month”, “This Year”).
To apply the changes, click the Apply button. If you change your mind, you can close the calendar by clicking anywhere outside the window or reset the selected dates using the Clear button.
b. Search bar by phone number: A field for finding records by a full or partial match in the phone number. Start entering the data, and the system performs the search automatically.
c. Filters with the option to select one or multiple values:
-
Campaign;
-
Lead List;
-
Agent Group;
-
Agent;
-
Disposition;
-
Country (filtering by country code);
-
Status (value set by the agent).
You can start typing the name of the required parameter for a quick search and to shorten the list of available options. After selecting the values, the general table will display only the records that match the chosen filters.
Additionally, you can combine filters to narrow your search.
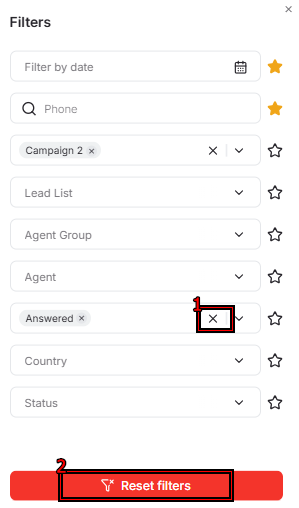
You can reset the configured filters in several ways:
- In the pop-up window - delete each filter individually by clicking the “X” next to the corresponding field (1), or click the “Reset filters” button at the bottom of the window (2) to clear all parameters at once.
- On the top panel - click the “X” next to the name of a specific filter (1) or click the red “Reset filters” button (2) to cancel all active filters.

-
Report download button. This button lets you download the full list or only the filtered records to your device in .csv format. To get a specific data sample, simply configure the filtering parameters and then click the Download button.
-
Call data table consisting of the following columns:
a. Call creation date;
b. Campaign (to which the lead belonged at the time of the call);
c. Lead List (to which the lead belonged at the time of the call);
d. Agent (who answered the call);
e. Customer name;
f. Customer phone;
g. Duration (total call duration from the start of dialing until the customer card processing is complete);
h. On Call Time (combines dialing time and the conversation period);
i. Talk Time (time of active connection with the customer);
j. Disposition (actual call status);
k. Call status (set by the agent);
l. Voice Record (listen to calls directly in the system using the built-in player or download them in .wav format using the specific buttons).
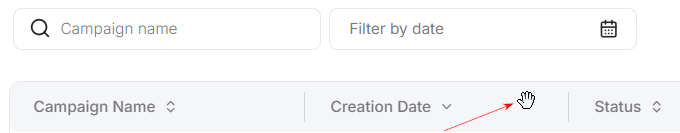
You can rearrange the column order directly within the table for your convenience. To do this, hover the cursor over the column name. When the cursor changes to a hand icon, press and hold the column with the left mouse button and drag it to the desired position.
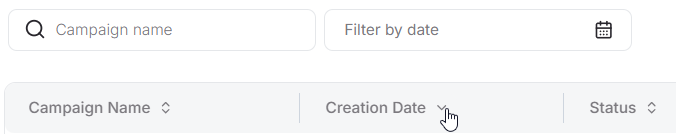
A sorting function is also available in the system. To activate this option, click the arrow next to the column name, and the data will automatically be sorted in ascending order. To change the order to descending, click the same arrow again.
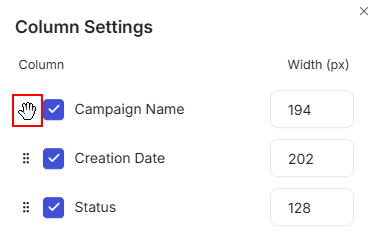
Additionally, the system provides the option to individually customize columns; to do this, click the Settings icon:

In the window that opens, you can adjust column widths, use the checkboxes to show or hide specific columns, and change their sequence. To change the order, hover your cursor over the dotted icon. When the cursor changes to a hand icon, press and hold the selected column with the left mouse button and drag it to the desired position:
All changes are applied automatically and reflected in the interface instantly. If you wish to revert the column settings to their original parameters, click the Reset to Defaults button.
- Rows per page: Below the table, you can select the number of records to be displayed on a single page. The following options are available:
a. 10;
b. 15;
c. 25;
d. 50;
e. 100.
Campaign statistics
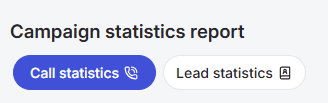
The Campaign statistics report provides detailed information about dialing results within specific campaigns and contact lists. The analytics on this page are divided into two separate tables that you can switch between:
Both tables share the same control panel and appearance. The reports differ in their data display hierarchy and the speed of access to customer information.
-
Call statistics groups results by campaign, lead list, and agent.
-
Lead statistics, instead, offers a quick transition from a campaign directly to a specific lead and their full call history.
-
Note that any changes made in one table are automatically applied to the other.
Control panel
The following tools are available to customize the report view:
- Calendar. Information in the report displays according to the actual dates when calls were made. This means if a campaign or calls occurred in March, but the calendar is set to April, the data will not be available.
The required time range is selected using the built-in calendar. To do so, simply click the calendar button:
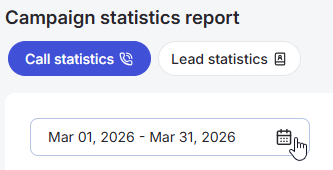
A pop-up window will then appear for selecting the desired period. To set the date range, use one of the following methods:
-
Click the dates on the calendar to select the start and end dates;
-
Select one of the presets (“Today”, “Yesterday”, “This Week”, “This Month”, “This Year”).
To apply the changes, click the Apply button. If you change your mind, you can close the calendar by clicking anywhere outside the window or reset the selected dates using the Clear button.
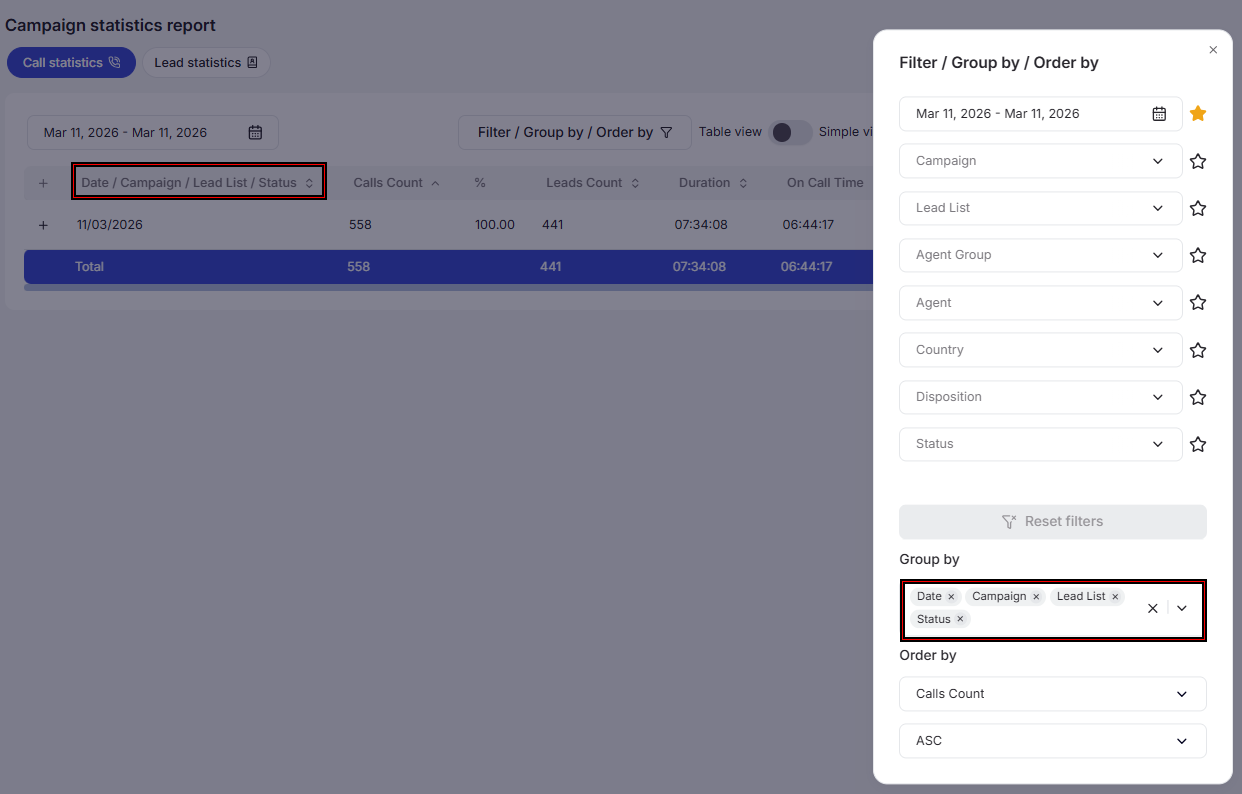
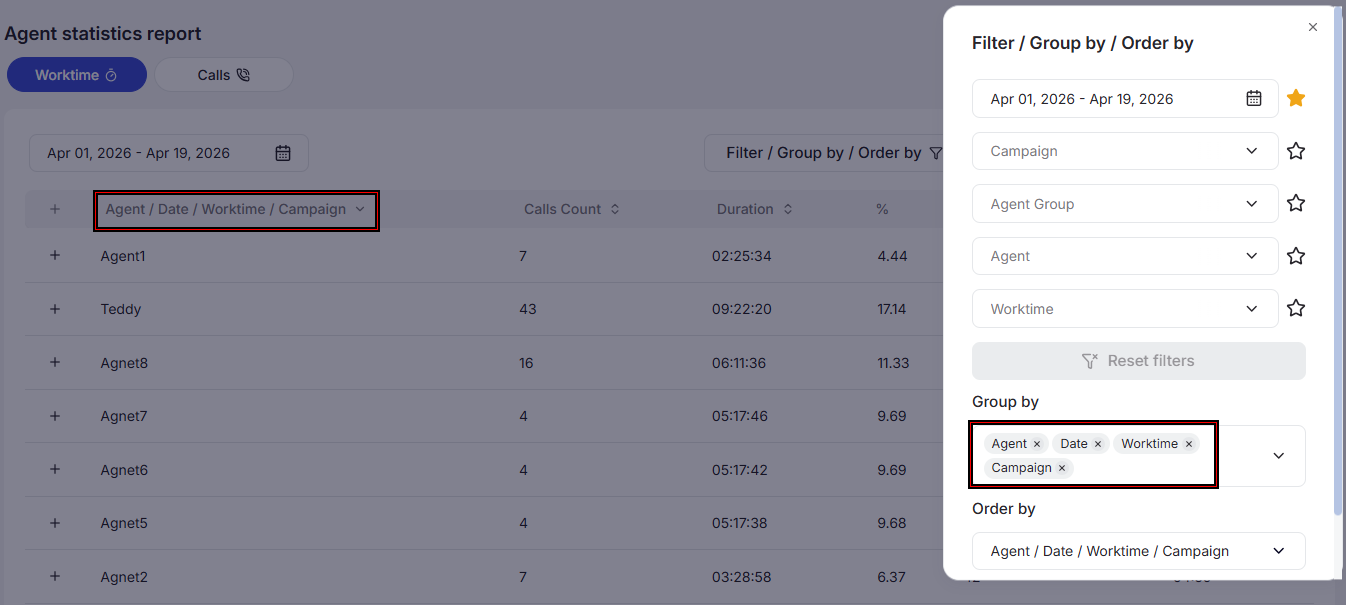
- The Filter / Group by / Order by button, which lets you customize the data table to suit your specific tasks.
-
Filtering. This tool allows you to isolate data based on selected parameters. Available filters: Date, Campaign, Lead Lists, Agent Group, Individual agent, Phone number country code, Disposition, Call status. You can select one or multiple parameters for filtering and combine filters as needed. For more details on how filters work, refer to this section.
-
Grouping. This function merges rows with identical values to create a clear report structure. The system builds the hierarchy in the exact order that parameters are selected. In Table View mode, the first column of the table automatically displays your set grouping criteria.
- Sorting. You can choose the field to sort the data by and the sorting order - either ascending or descending. Sorting functionality is available even for fields created as a result of custom data grouping.
- Table view selection. Use the toggle to choose the mode that suits you best:
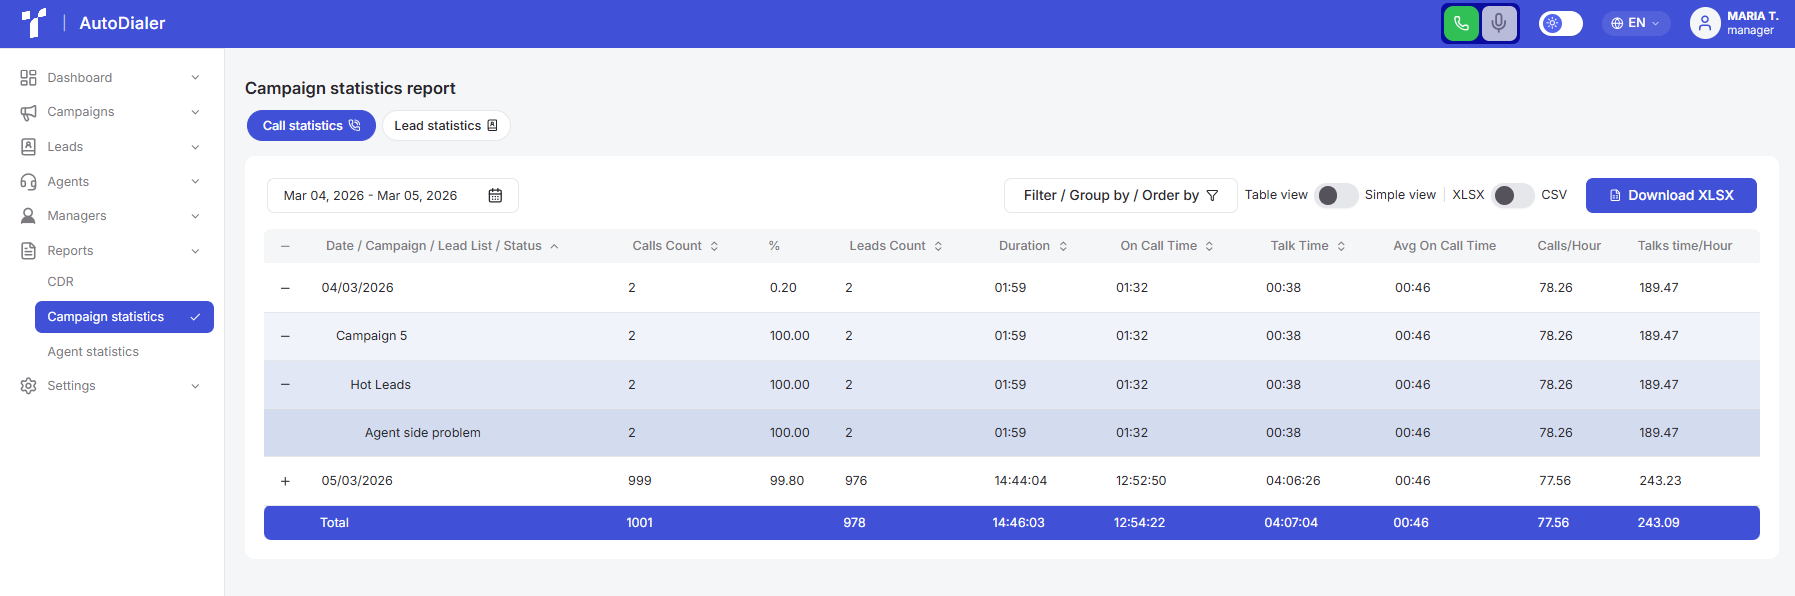
Table view. Information is grouped by levels depending on the parameters you specified in the grouping. Records are initially in a collapsed state and open progressively for deep analysis of each database segment. Table view is set by default in the system.
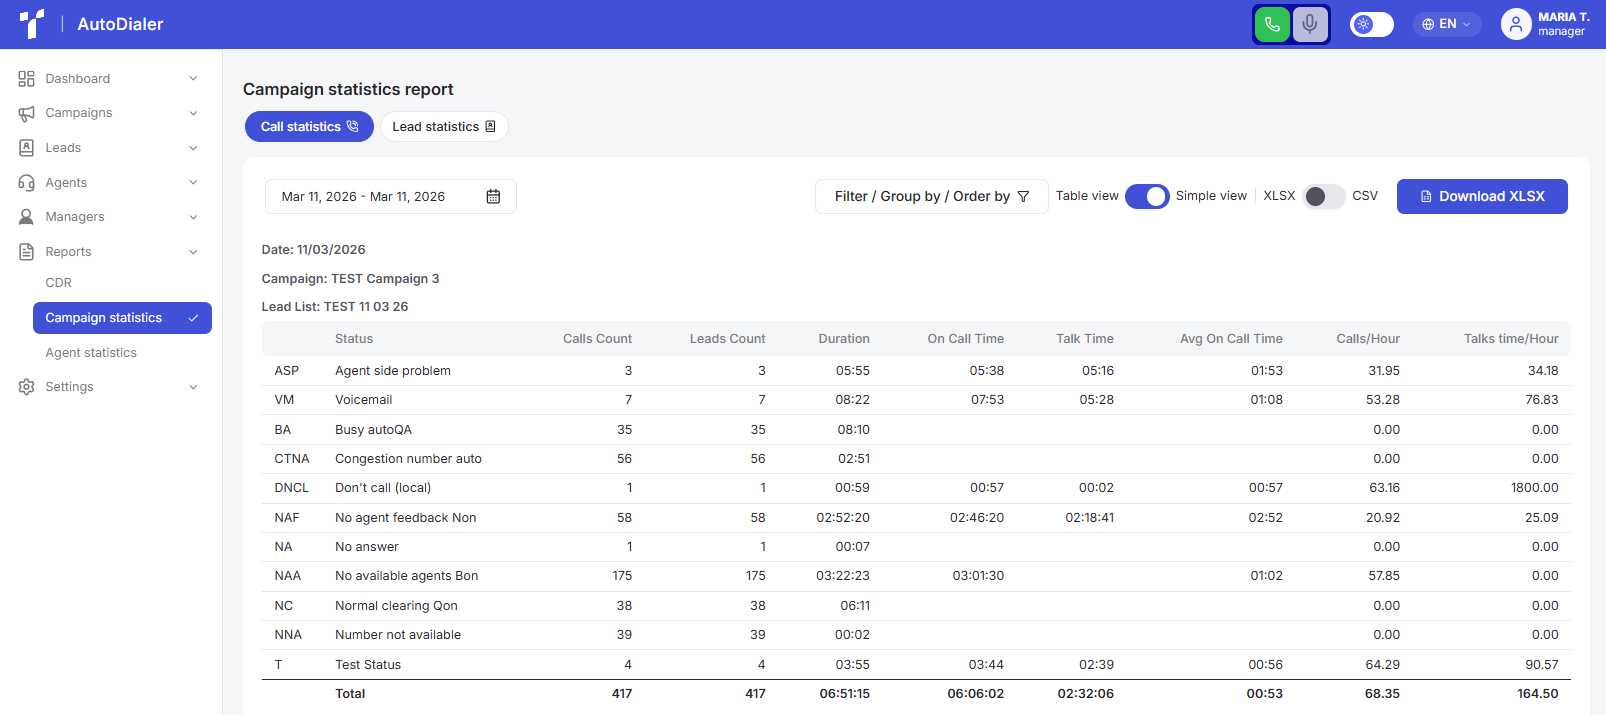
Simple view. All metrics are displayed as a single expanded list in a table format. This allows you to instantly assess the overall picture and see all statuses simultaneously on one screen.
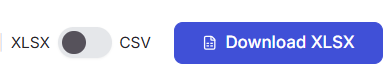
- Report download button. This button allows you to download the complete list or only filtered records to your device in .csv or .xlsx formats. To get a sample of specific data, you first need to configure the filtering/sorting/grouping parameters and only then click the Download button. To select the required format, use the toggle next to the button:
Data table
The table consists of the following columns:
a. Date/Campaign/Lead Lists/Status - the content of this column changes according to the selected grouping parameters. More details are provided in the previous section.
b. Calls Count.
c. Percentage (%) - displays the percentage of the total number of calls, depending on the breakdown: the indicator will vary for the entire time period versus specific campaigns on a single date.
d. Leads Count in campaigns.
e. Duration - total duration from the start of dialing until the customer card processing is complete.
f. On Call Time - combines dialing time and the conversation period.
g. Talk Time - time of active connection with the customer.
h. Average on Call Time.
i. Calls/Hour - number of calls per hour.
j. Talks time/Hour - talk time per hour.
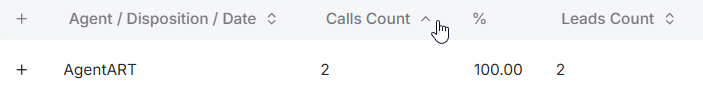
You can quickly sort values directly in the table. To activate this option, click the arrow next to the column name to automatically sort data in ascending order. To change the order to descending, click the same arrow again.
Agent statistics
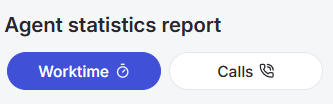
This section provides detailed analytics of agent performance for the selected period. Analytics on this page are divided into two separate tables that you can switch between:
-
Worktime. This tab allows you to track exactly how an agent spent their time during a shift.
-
Calls. This tab focuses on performance and quantitative metrics.
Both tables have the same control panel, which is described below.
Control panel
The following tools are available to customize the report view:
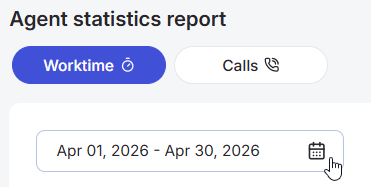
- Calendar. Information in the report displays according to the actual dates when calls were made. This means if a campaign or calls occurred in March, but the calendar is set to April, the data will not be available.
The required time range is selected using the built-in calendar. To do so, simply click the calendar button:
A pop-up window will then appear for selecting the desired period. To set the date range, use one of the following methods:
-
Click the dates on the calendar to select the start and end dates;
-
Select one of the presets (“Today”, “Yesterday”, “This Week”, “This Month”, “This Year”).
To apply the changes, click the Apply button. If you change your mind, you can close the calendar by clicking anywhere outside the window or reset the selected dates using the Clear button.
- The Filter / Group by / Order by button, which lets you customize the data table to suit your specific tasks.
-
Filtering. This tool allows you to isolate data based on selected parameters. Depending on the selected tab (“Worktime” or “Calls”), specific filtering parameters will be available to you. You can select one or multiple parameters for filtering and combine filters as needed. For more details on how filters work, refer to this section.
-
Grouping. This function merges rows with identical values to create a clear report structure. The system builds the hierarchy in the exact order parameters are selected. In the data table, the first column automatically displays the set grouping criteria.
- Sorting. You can choose the field to sort the data by and the sorting order - either ascending or descending. Sorting functionality is available even for fields created as a result of custom data grouping.
- Report download button. This button allows you to download the full list or only filtered records to your device in .csv or .xlsx formats. To get a sample of specific data, you need to first configure the filtering/sorting/grouping parameters and then click the Download button. To choose the required format, use the toggle next to the button:

Data table
A table with detailed analytics is located below the control panel. Metric parameters and the set of columns change automatically depending on the selected subsection.
Worktime
In this subsection, the table uses Table View, where information is grouped by levels depending on the parameters you specified in the grouping. Records are initially in a collapsed state and open progressively for deep analysis of each database segment.
Here you can see information about agents' time spent in specific statuses and pause reasons:
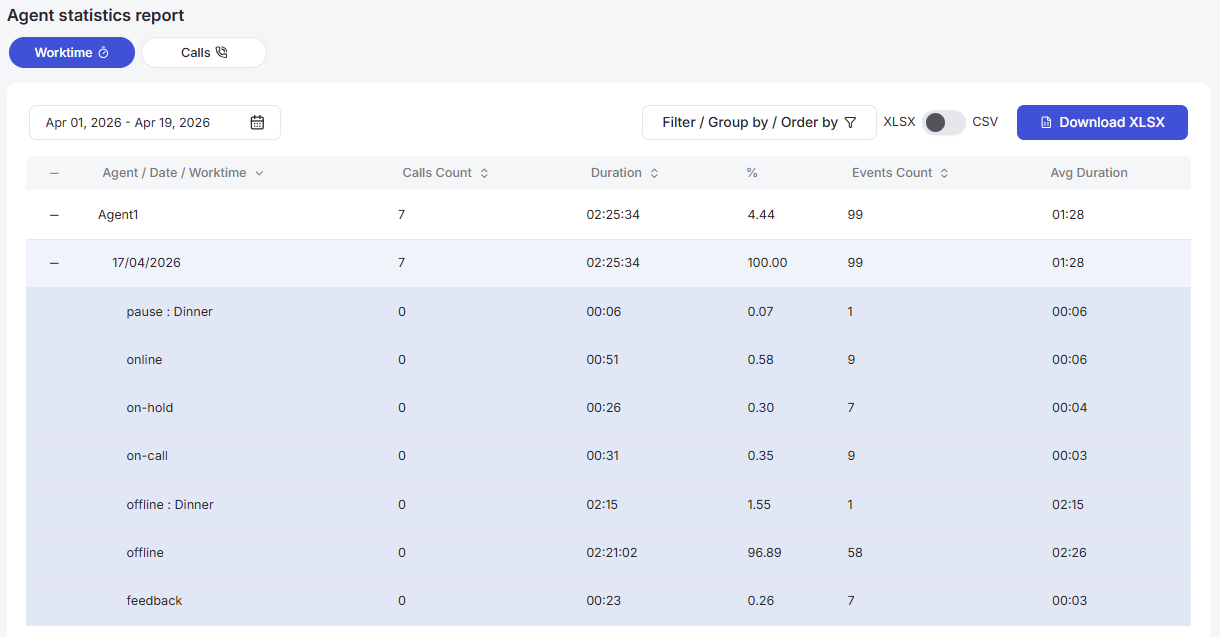
The table has the following columns:
-
Agent/Date/Worktime - the content of this column changes according to the selected grouping parameters.
-
Calls Count.
-
Duration - total time the agent spent in the status.
-
Percentage (%) - displays the percentage of the total number of calls depending on the breakdown: the indicator will vary for the entire time period versus specific campaigns on a single date.
-
Events Count - number of changes to the corresponding statuses.
-
Average duration - average time spent in the status.
The bottom part of the report contains summary performance metrics for the entire team. This information changes dynamically according to the selected time range in the calendar and the filters set on the control panel.
Calls
In this subsection, the table uses Table View, where information is grouped by levels depending on the parameters you specified in the grouping. Records are initially in a collapsed state and open progressively for deep analysis of each database segment.
This tab displays statistics of completed calls and their processing results broken down by each agent:
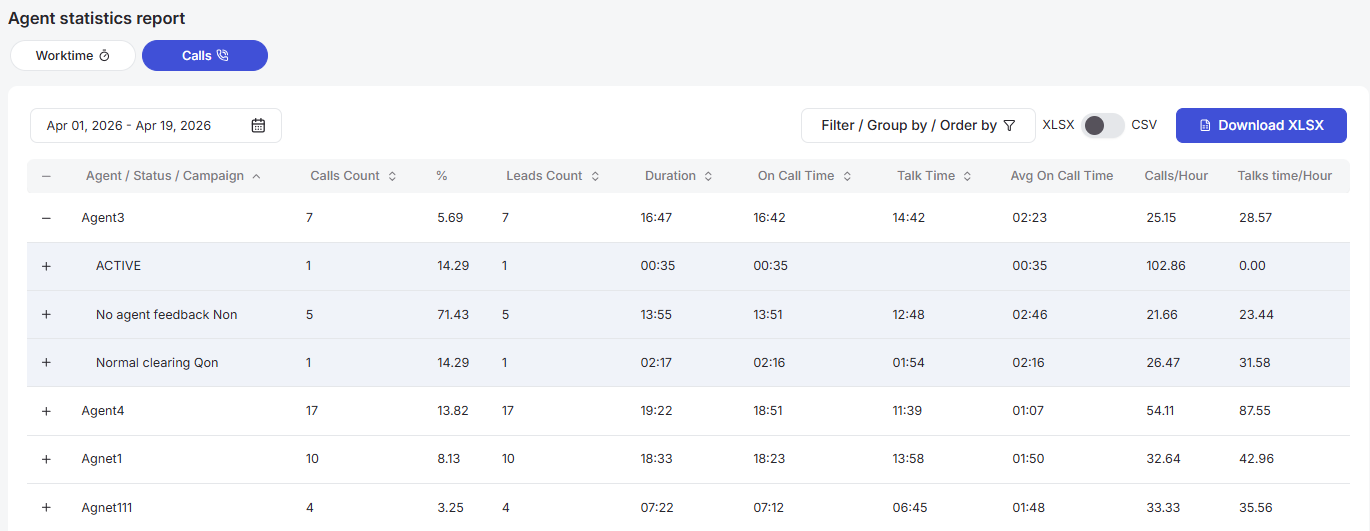
The table has the following columns:
-
Agent/Status - the content of this column changes according to the selected grouping parameters.
-
Calls count.
-
Percentage (%) - displays the percentage of the total number of calls, depending on the breakdown: the indicator will vary for the entire time period versus specific campaigns on a single date.
-
Leads Count - leads processed by the agent within the campaign.
-
Duration - total call duration from the start of dialing until the customer card processing is complete.
-
On Call Time - combines dialing time and the conversation period.
-
Talk Time - time of active connection with the customer.
-
Average On Call Time.
-
Calls/Hour - number of calls per hour.
-
Talk time/Hour - talk time per hour.
The bottom part of the report contains summary performance metrics for the entire team. This information changes dynamically according to the selected time range in the calendar and the filters set on the control panel.
Managers
This document describes the Managers section in the Teliqon Autodialer Software system. It explains how to view managers assigned to a project, search the managers list, sort table data, and customize table columns.
Settings
This document describes the Settings section in the Teliqon Autodialer software and explains how to configure account, campaign, lead, and work time parameters. It covers personal information, security, campaign defaults, lead statuses, and pause types used by agents.
